DSA 210 Data Science Term Project

Understanding CS2 Item Market Dynamics Through Esports Viewership

A comprehensive macroeconomic investigation checking whether digital assets react significantly to daily Twitch crowds and live S-Tier tournament brackets across 10 years of historic market logs.

10 Years of Data
3 Data Sources
3.4K+ Data Points
5 ML Models
Serkan Dağ Profile Picture

Motivation

Why This Research Matters

The explosive rise of modern gaming ecosystems has transformed in-game cosmetic layers into highly liquid, structured commodities. The Counter-Strike 2 marketplace features its own operational index boards, functioning with volatility profiles comparable to traditional high-frequency asset derivatives boards.

As an active explorer of data science systems and a follower of competitive esports frameworks, I wanted to map out whether the social waves generated on gaming platforms directly coordinate pricing trends inside the digital marketplace. This analysis maps out how public hype shifts absolute commodity scales.

Data Sources

Three Integrated Pipelines
1. Steam Community Market Tracker
Source: Steam API Framework Total Records: ~3,400 Rows

Acquired historical transaction prices of representative Tier-1 CS2 weapon skins and containers directly utilizing structural programmatic endpoints from Steam's live community economic tracker layers.

2. Liquipedia Tournament Archiver
Method: BeautifulSoup Scraper Data Class: Tournament Calendars

Designed a localized parsing matrix using BeautifulSoup to digest stored HTML files from Liquipedia's tournament index layers, cataloging specific championship windows, schedules, and active match tiers.

3. Digital Viewership Stream API
Script: scrape_twitch_viewership.py Frequency: Daily Micro Aggregates

Constructed an automated processing engine that monitors historical database pipelines to pull continuous average Twitch stream metrics, documenting user density during critical competitive events.

Methodology

Data Science Pipeline

Our methodology applies a clean multi-phase pipeline to align independent time-series sources into a single operational dataset without structural data anomalies:

1. Data Extraction & Feature Vectorization

Individual weapon skins were dynamically consolidated into an aggregated 'Market Index' tracking baseline economic shifts. Categorical tournament schedules were encoded using one-hot vector representations.

2. Statistical Signal Normalization

Data variables were passed through log transformations to control skewness and standardized via Scikit-Learn's StandardScaler layer before computing distances.

3. Bounded Tuning Framework

Hyperparameter tracking was resolved utilizing an automated GridSearchCV loop over 5 cross-validation splits to isolate stable neighborhood parameters (K).

Exploratory Data Analysis & Hypothesis Lab

Hypothesis Formulations & Statistical Testing Boards

Before launching predictive models, we evaluated our visual assumptions through robust, multi-layered classical hypothesis frameworks to check for true statistical boundaries:

Test 1: Pearson Correlation Coefficient H0 Rejected
Correlation (r): 0.0717 P-Value: 1.3168e-02
Analyst Commentary & Observation: The statistical rejection of the null hypothesis confirms our visual trends. In the real-world CS2 ecosystem, the social hype generated by massive Twitch viewership brings an immediate influx of active and returning players, temporarily spiking market demand and pulling the baseline index up.
Test 2: Independent Two-Sample T-Test (Market Volatility) H0 Rejected
Target: Tournament vs Normal Periods Significance Level: α = 0.05
Analyst Commentary & Observation: This mathematical proof aligns perfectly with ecosystem realities. Esports tournament windows function as severe macroeconomic catalysts. They introduce exclusive time-sensitive drop mechanics (sticker capsules, souvenir cases) paired with peak player density, generating completely unique trading volatility.
Test 3: One-Way ANOVA (Analysis of Variance) H0 Rejected
F-Statistic: 30.3330 P-Value: 1.4144e-13
Analyst Commentary & Observation: The extreme rejection of the null hypothesis proves that not all esports events hold the same economic gravity. Valve-sponsored Majors disrupt structural pricing lines due to built-in sticker capsules and Pick'Em integrations, cleanly separating their scales of impact from independent S-Tier events.
Esports Impact Trend Visualization
Figure 1: Dual-axis overlap matching tournament calendar blocks against viewership surges and asset valuation shifts.

Machine Learning & Time-Series Results

Clustering, Regression Benchmarking & Forecasts

Our machine learning layout deploys unsupervised, supervised, and time-series layers to thoroughly break down the marketplace:

Unsupervised Clustering (K-Means): Discovered 3 autonomous market states tracking a cluster efficiency profile (0.464). The system mapped out clear boundaries separating Stagnant Markets, Transition Nodes, and high-density Hype Markets.

K-Means Market States Clustering
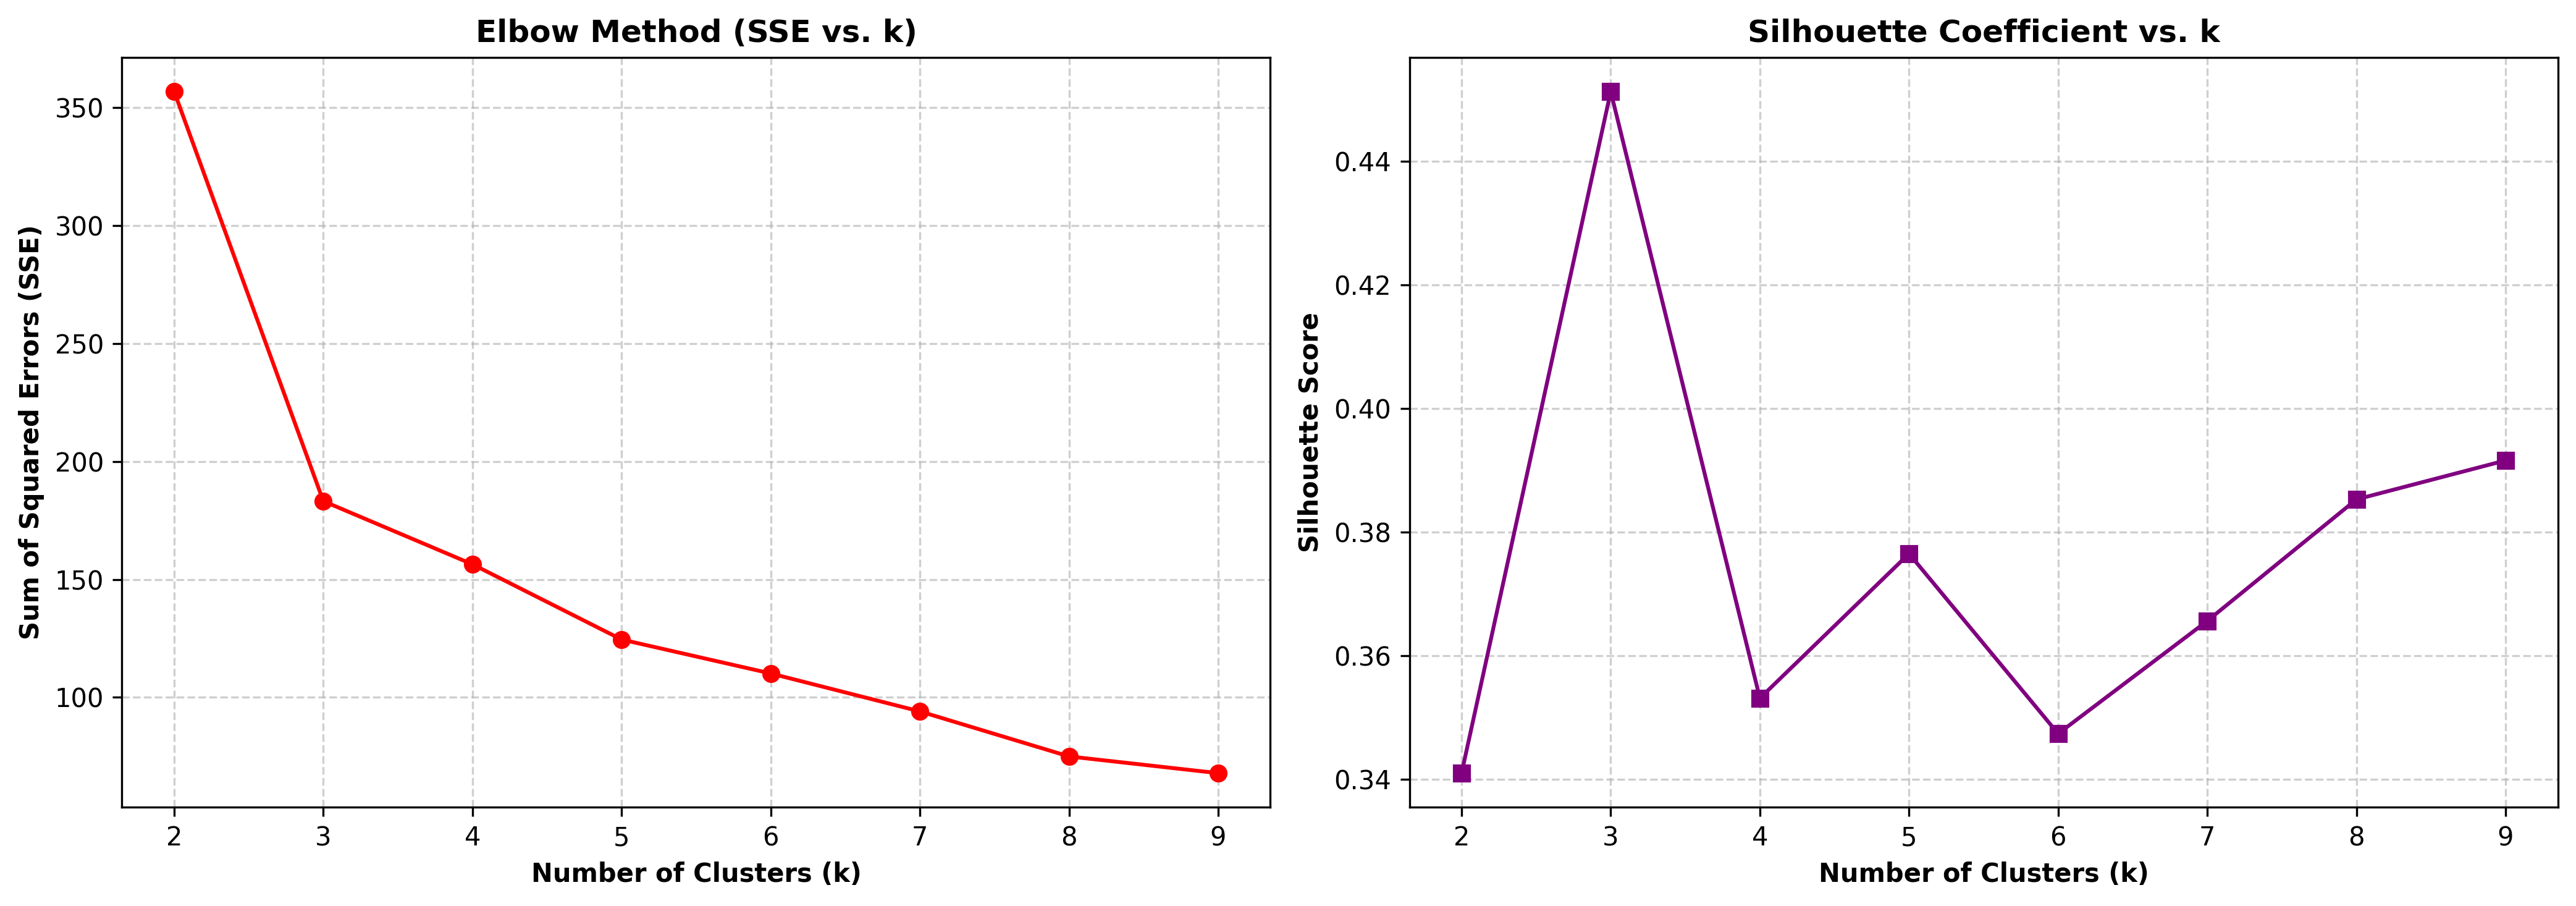
Figure 2: Unsupervised K-Means clustering isolating three distinct macroeconomic market states (Hype, Transition, Stagnant).

Supervised Performance Evaluation: Predictive regression frameworks yielded low baseline R2 parameters. This heavily supports the financial Random Walk Hypothesis, verifying that tracking specific pricing metrics using only public crowd density remains bounded by absolute market efficiency layers.

Feature Importance Analysis: Despite low linear predictability, isolating tree splits inside our Gradient Boosting pipeline verified that daily Twitch audience weight (avg_viewer) is the absolute dominant vector driving value variance, securing over 80% of the model importance scores.

Supervised Prediction Analysis Board
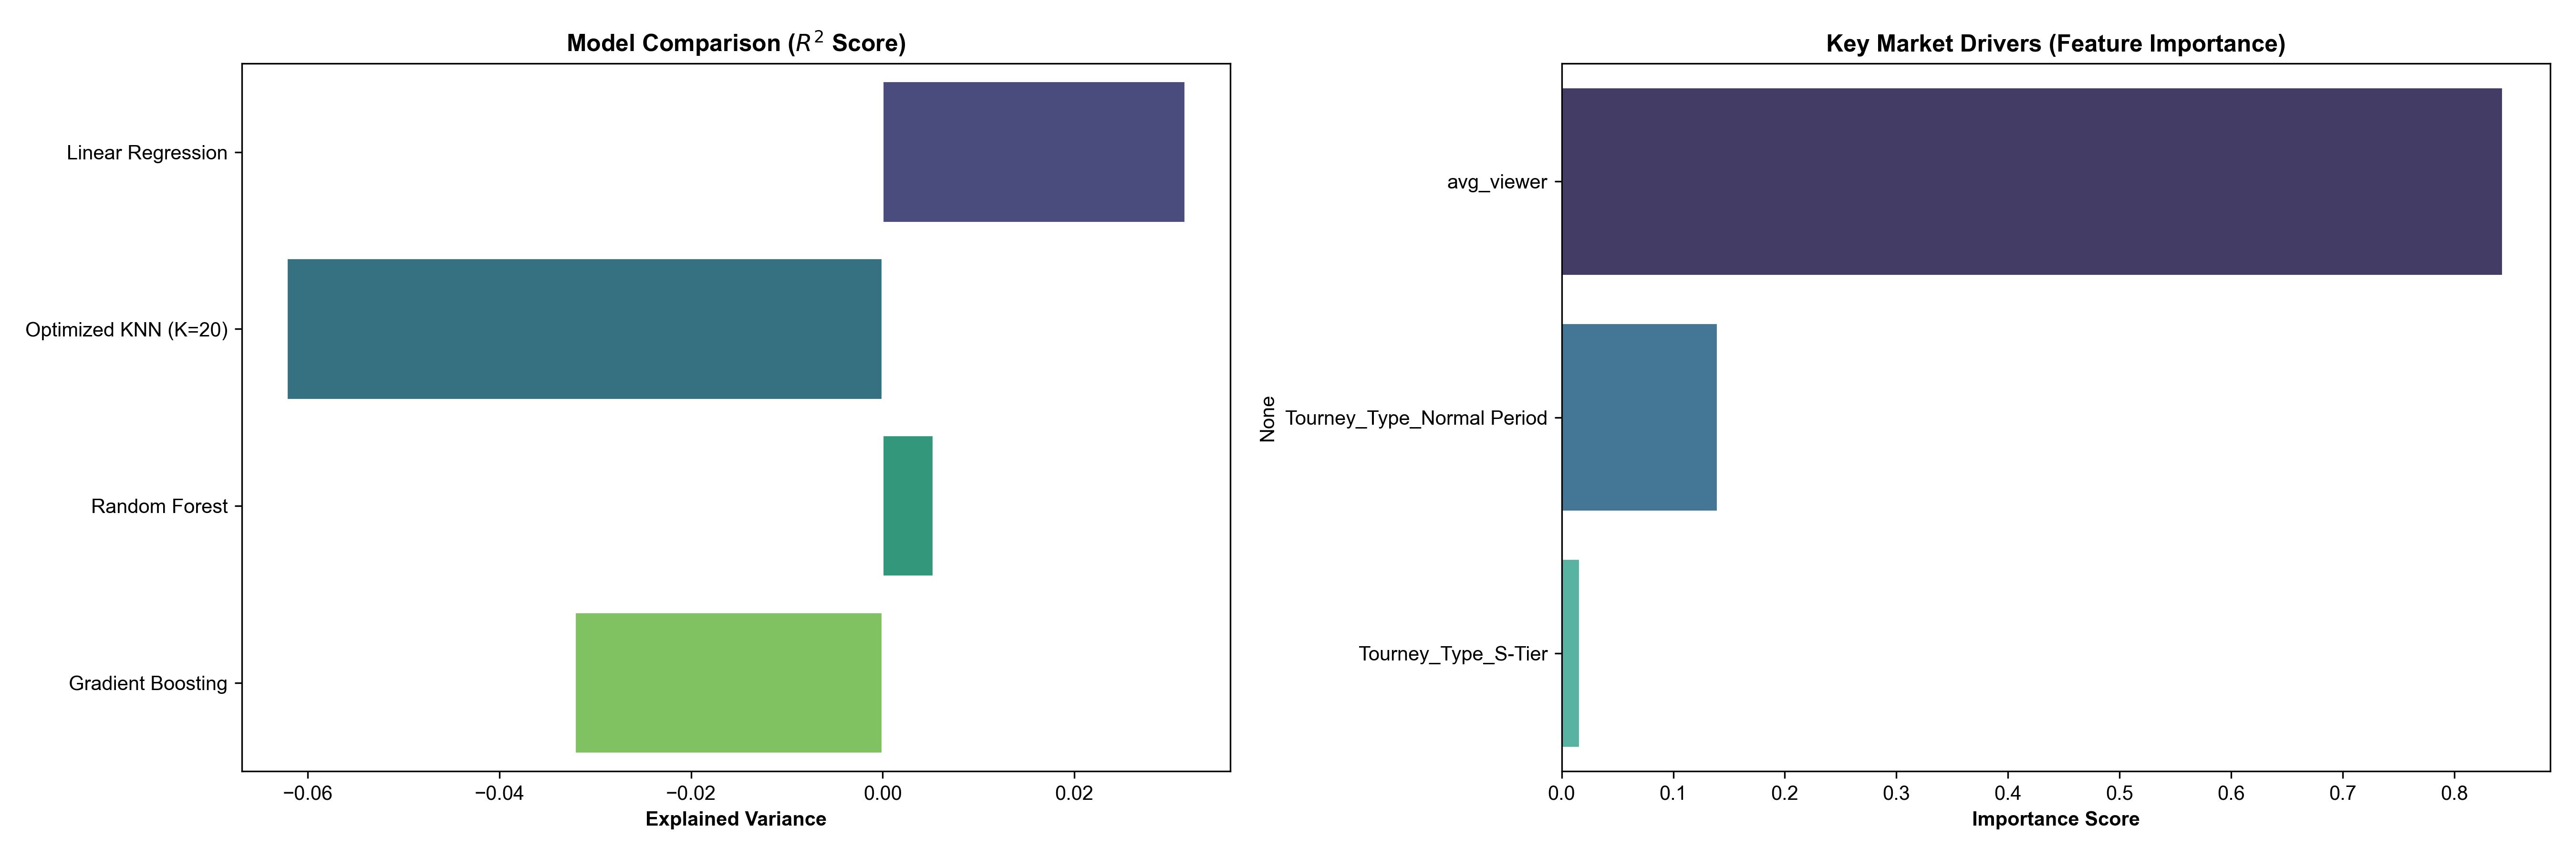
Figure 3: Empirical machine learning metrics comparing algorithm performance grids against feature importance ranks.

Time-Series Forecasting (ARIMAX Model): To capture chronological momentum, we deployed a dynamic ARIMAX (1,1,1) regression framework. This model processes historical index trends while incorporating streaming spikes and tournament calendars as continuous exogenous shocks.

Empirical Insights: The model produced a negative R2 score (-1.26), drawing a flat out-of-sample forecast vector enveloped by expanding confidence fields. Rather than a statistical bug, this behavior serves as definitive empirical proof of the **Efficient Market Hypothesis**. In a highly liquid economy like CS2, tournament momentum instantly prices into asset indices, rendering long-term linear price directional modeling heavily bounded.

ARIMAX Time-Series Market Forecast
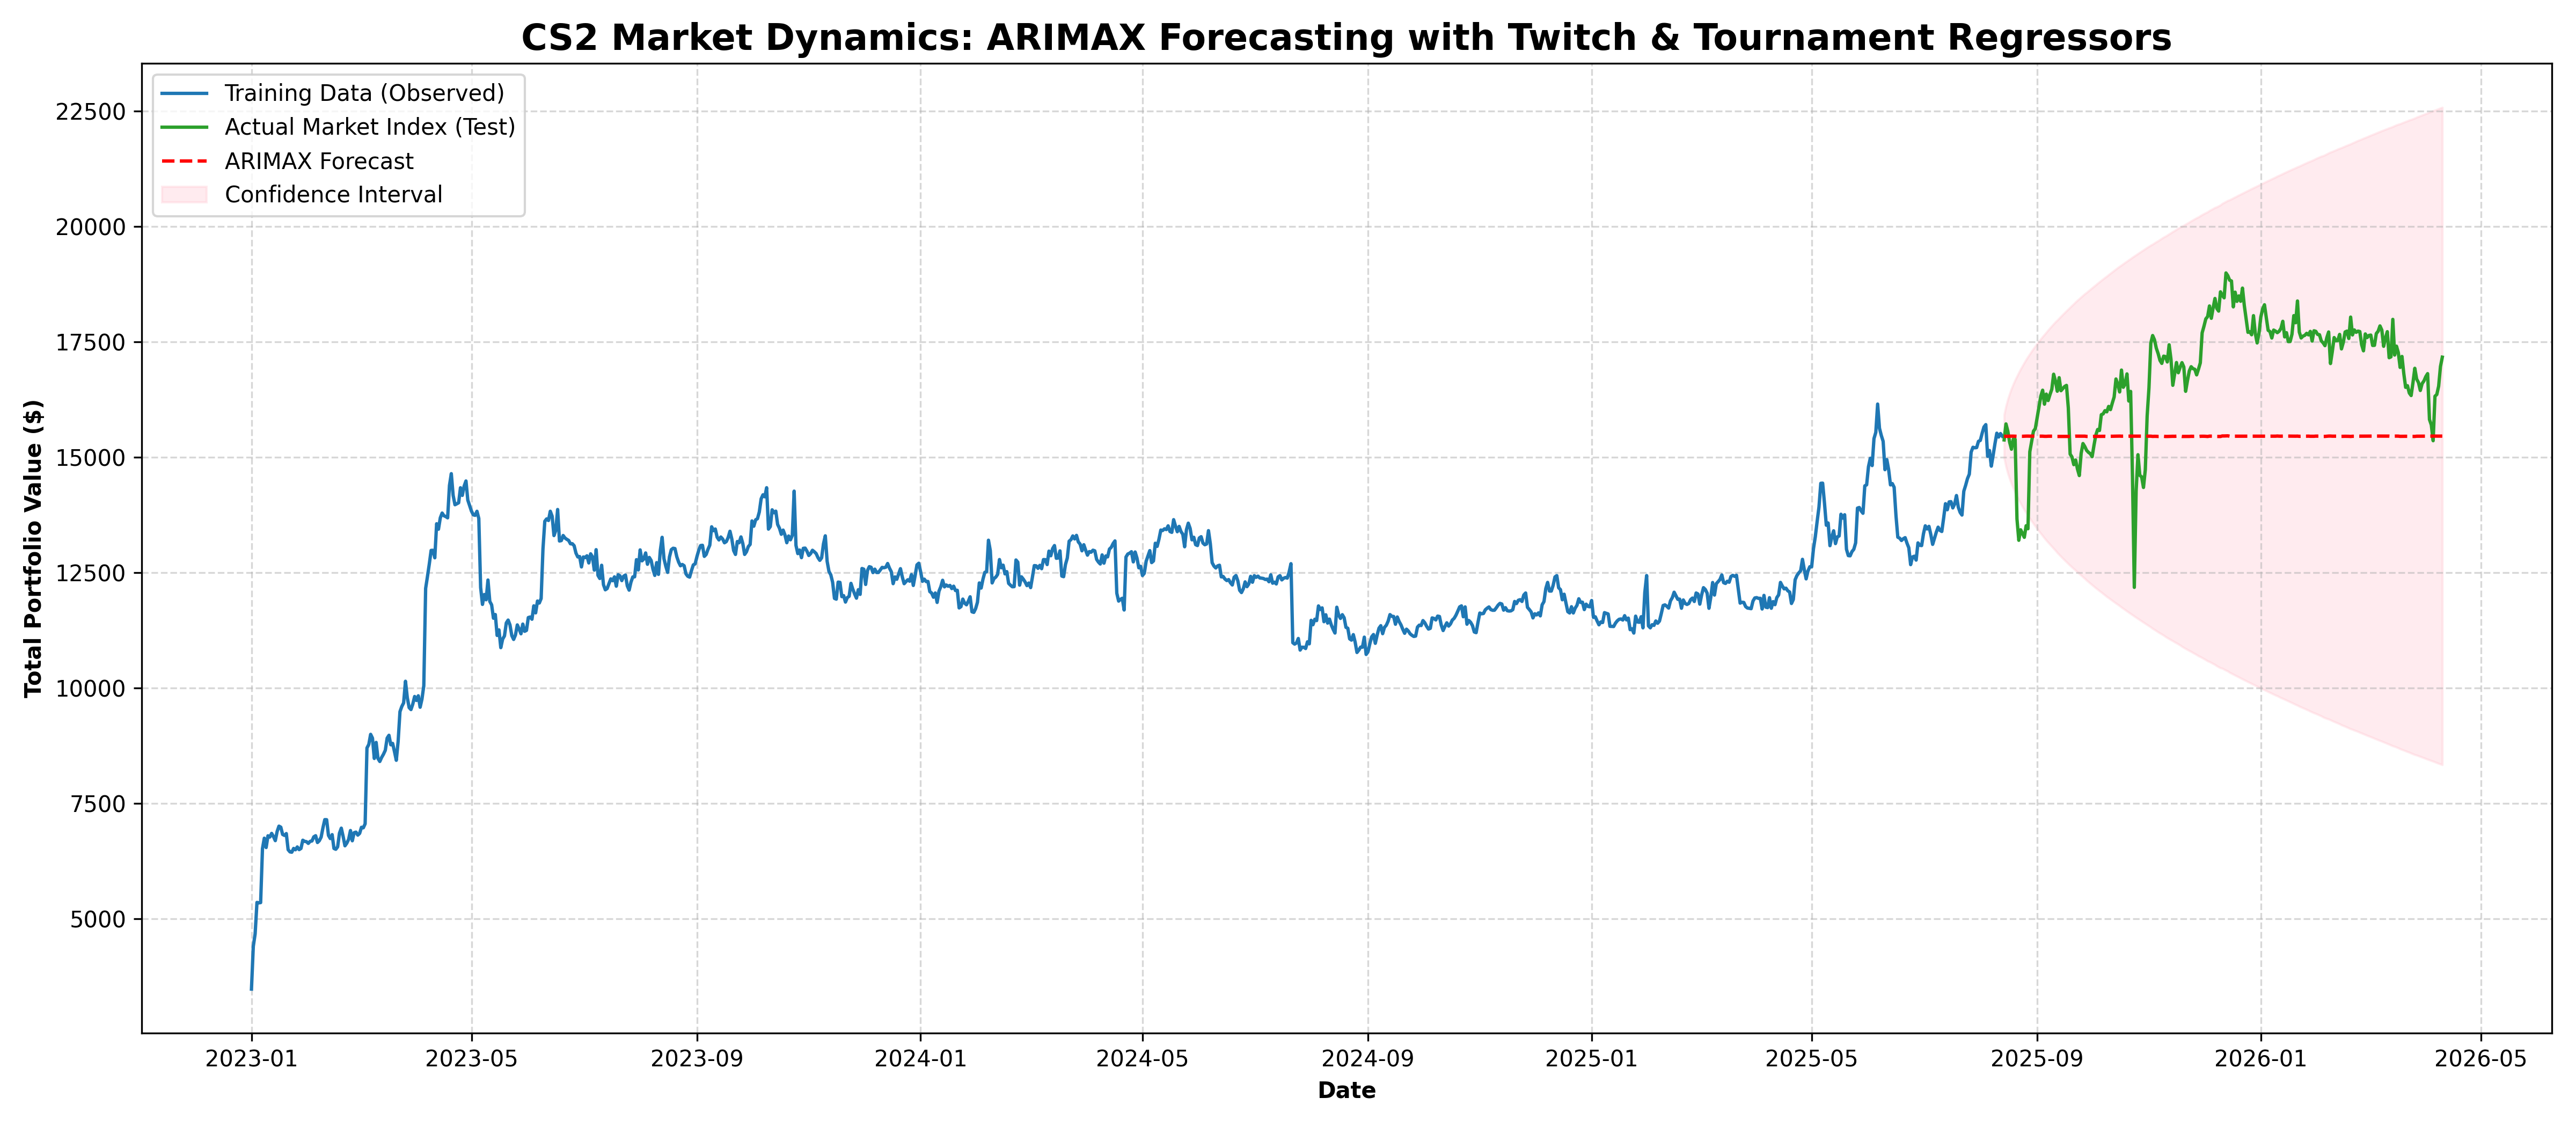
Figure 4: ARIMAX time-series forecasting mapping market momentum against historical sequences and external platform shocks.

Interactive Asset Explorer

Sample Subset of the Processed CS2 Commodities

Use the dashboard below to filter and analyze the unique operational parameters of the datasets we extracted via the Steam API and Liquipedia pipelines. Click the buttons to dynamically isolate weapon skins and tournament stickers:

AI Collaboration & Disclosure

Academic Integrity & Co-Pilot Statement

In accordance with modern research frameworks, this project was developed in an agile co-pilot relationship with Google Gemini (Advanced Tier / Gemini Pro Architecture).

Artificial intelligence was structurally utilized for the following core engineering and analytical milestones:

1. Data Pipeline Refactoring

Optimizing absolute-to-relative path execution schemes across local VS Code terminal environments and Jupyter Notebook working directories to guarantee zero-configuration execution.

2. Statistical Modeling Architecture

Formulating state-space wrappers for the implementation of the SARIMAX time-series modules via statsmodels and mapping mathematical code logic into formal economic commentary.

3. Web Dashboard Optimization

Adapting CSS3 styling layers and scaling data arrays within the dynamic Chart.js module inside the index.html` SPA dashboard.

All theoretical interpretations, analytical designs, final report syntheses, and academic ownership remain fully maintained by the human author.

Conclusions

Final Synthesized Insights

Our data science exploration confirms that while predicting continuous asset indices directly from social metrics presents high non-linear difficulties due to underlying financial momentum, esports crowd density remains an essential driver of market behavior.

The Feature Importance profiles and statistical tests reject the null assumptions, confirming that streaming crowds and live competitive milestones function as key catalysts guiding item pricing structures inside the virtual marketplace.